Dashboard access
This page assumes that you have already created and selected an environment.
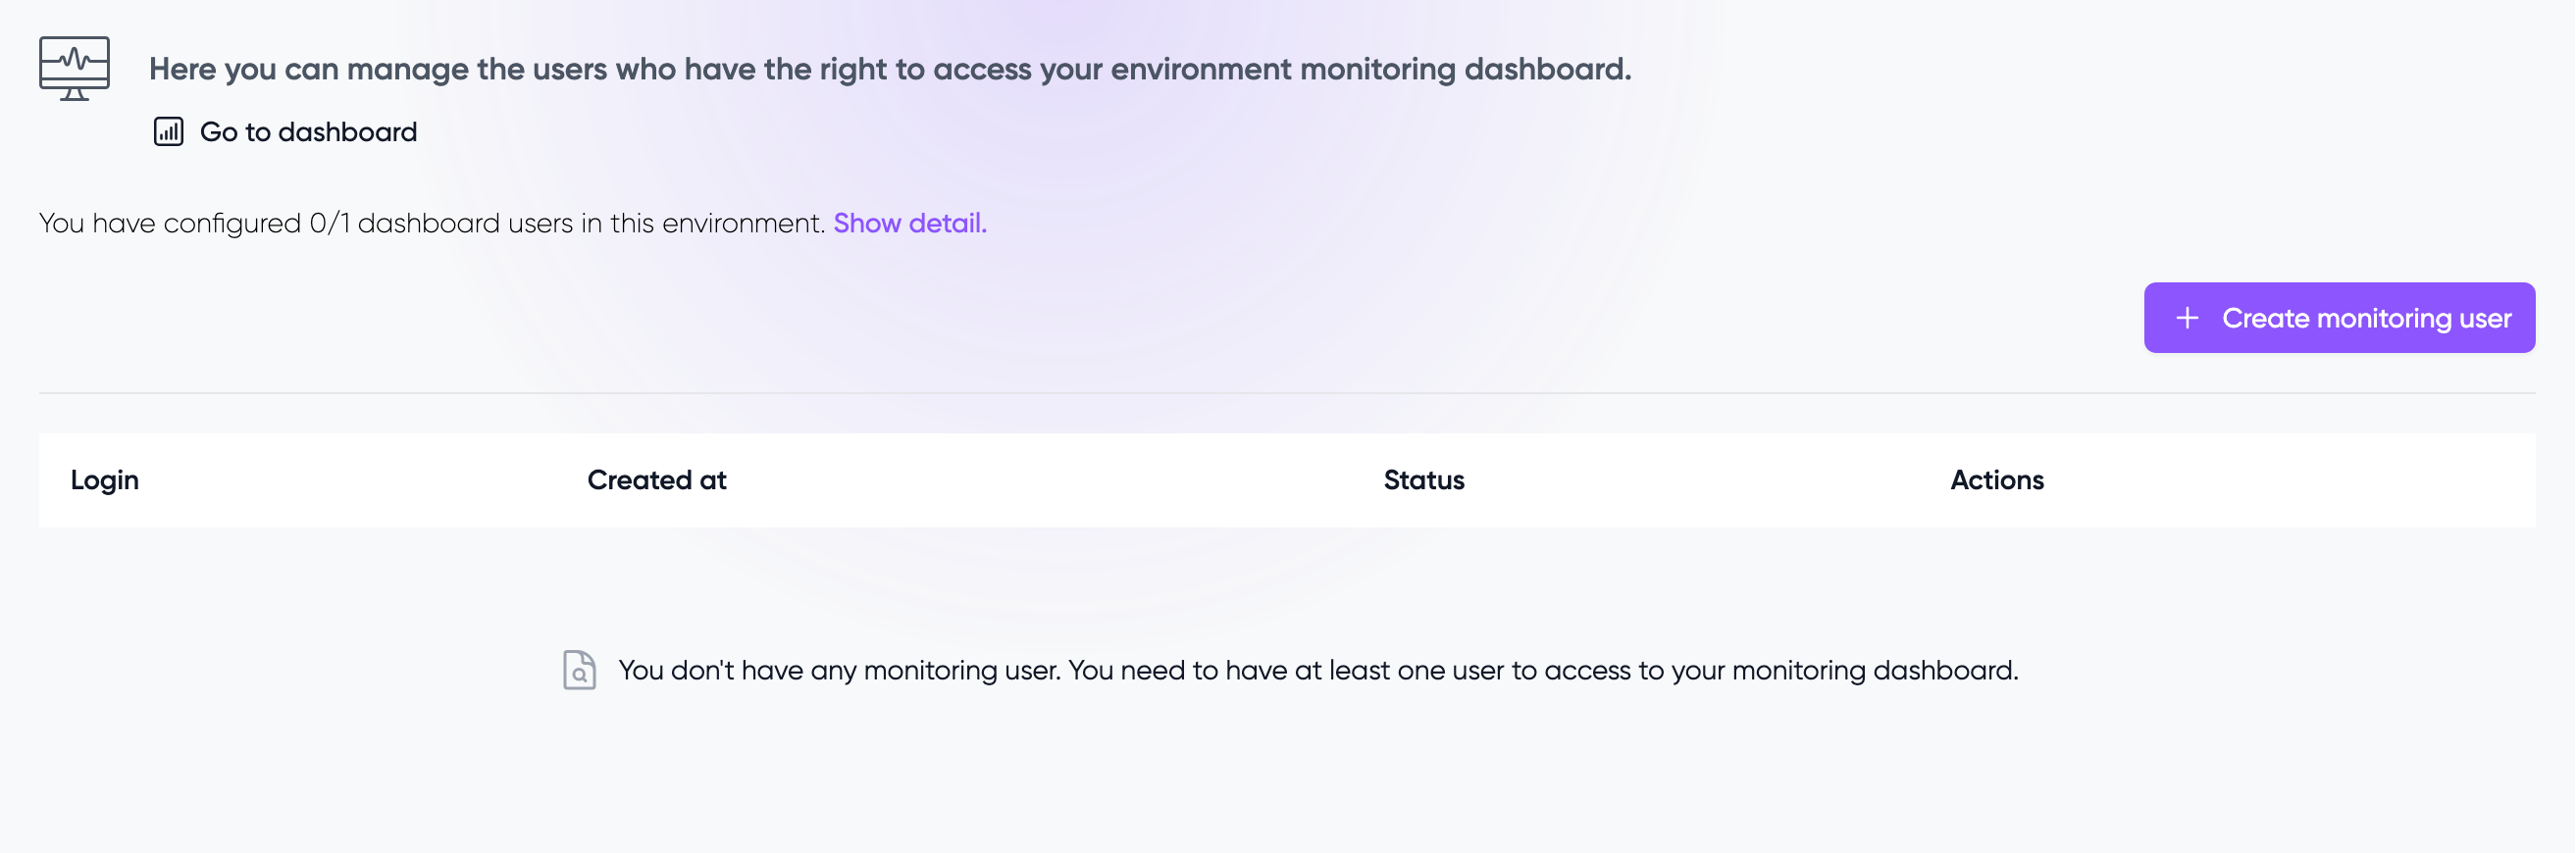
To access the external monitoring dashboards we create for you, you first need to create Grafana users.
Once you have created users, you can access the monitoring dashboards through Grafana. Additionally, for convenience, you'll find direct links to view detailed metrics and logs from your instance pools and services pages.
Quick access links
From your resources pages, you can find links to view detailed monitoring data:
- On instance pool pages: Links to view detailed metrics for your instances
- On service pages: Links to access detailed service metrics and logs
These links will take you directly to the relevant dashboards in Grafana.